More than a thousand words: explanatory graphics
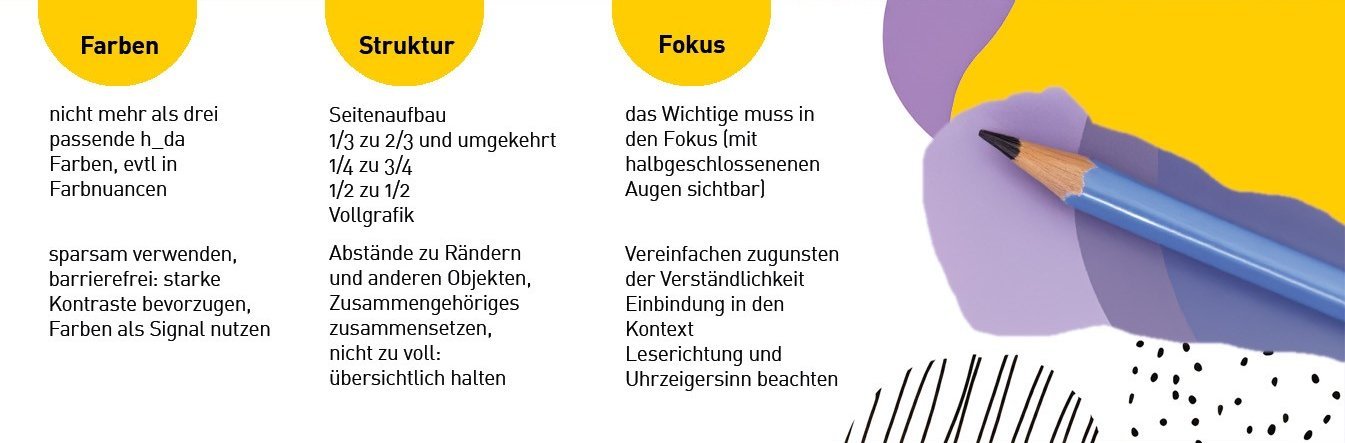
Motivating, easier to remember or easier to understand: This is what explanatory graphics can do for teaching. Because they present complex issues visually in a suitable way, learners understand them more easily. However, only if the graphic meets certain criteria. It is important to keep the graphics simple and to avoid an exuberant riot of color. Schematic images (sketches) are absorbed more quickly by the memory than complex images (photographs).
Do it yourself
If you want to create explanatory graphics yourself, you can also find inspiration online. Creating them is easy with the help of special tools, such as Canvas.
ChatGPT and other LLMs also generate images. By entering prompts (descriptions as a "command"), you can create your own image. Other tools such as PowerPoint, OneNote or Photoshop are classic software that can be used to create explanatory graphics.
Find suitable images
Don't have the time for DIY or AI generation?
Then you can also get a finished graphic this way: In Google, click on "images" under the desired keyword, then "search filter", then on "usage rights" and you can search for images with Creative Commons licenses. You may use these for your teaching if you cite the source. Existing graphics can be adapted using AI and/or Photoshop.